
How ever you calibrate it, Bradman is still the best (but Boycs ain’t bad!)
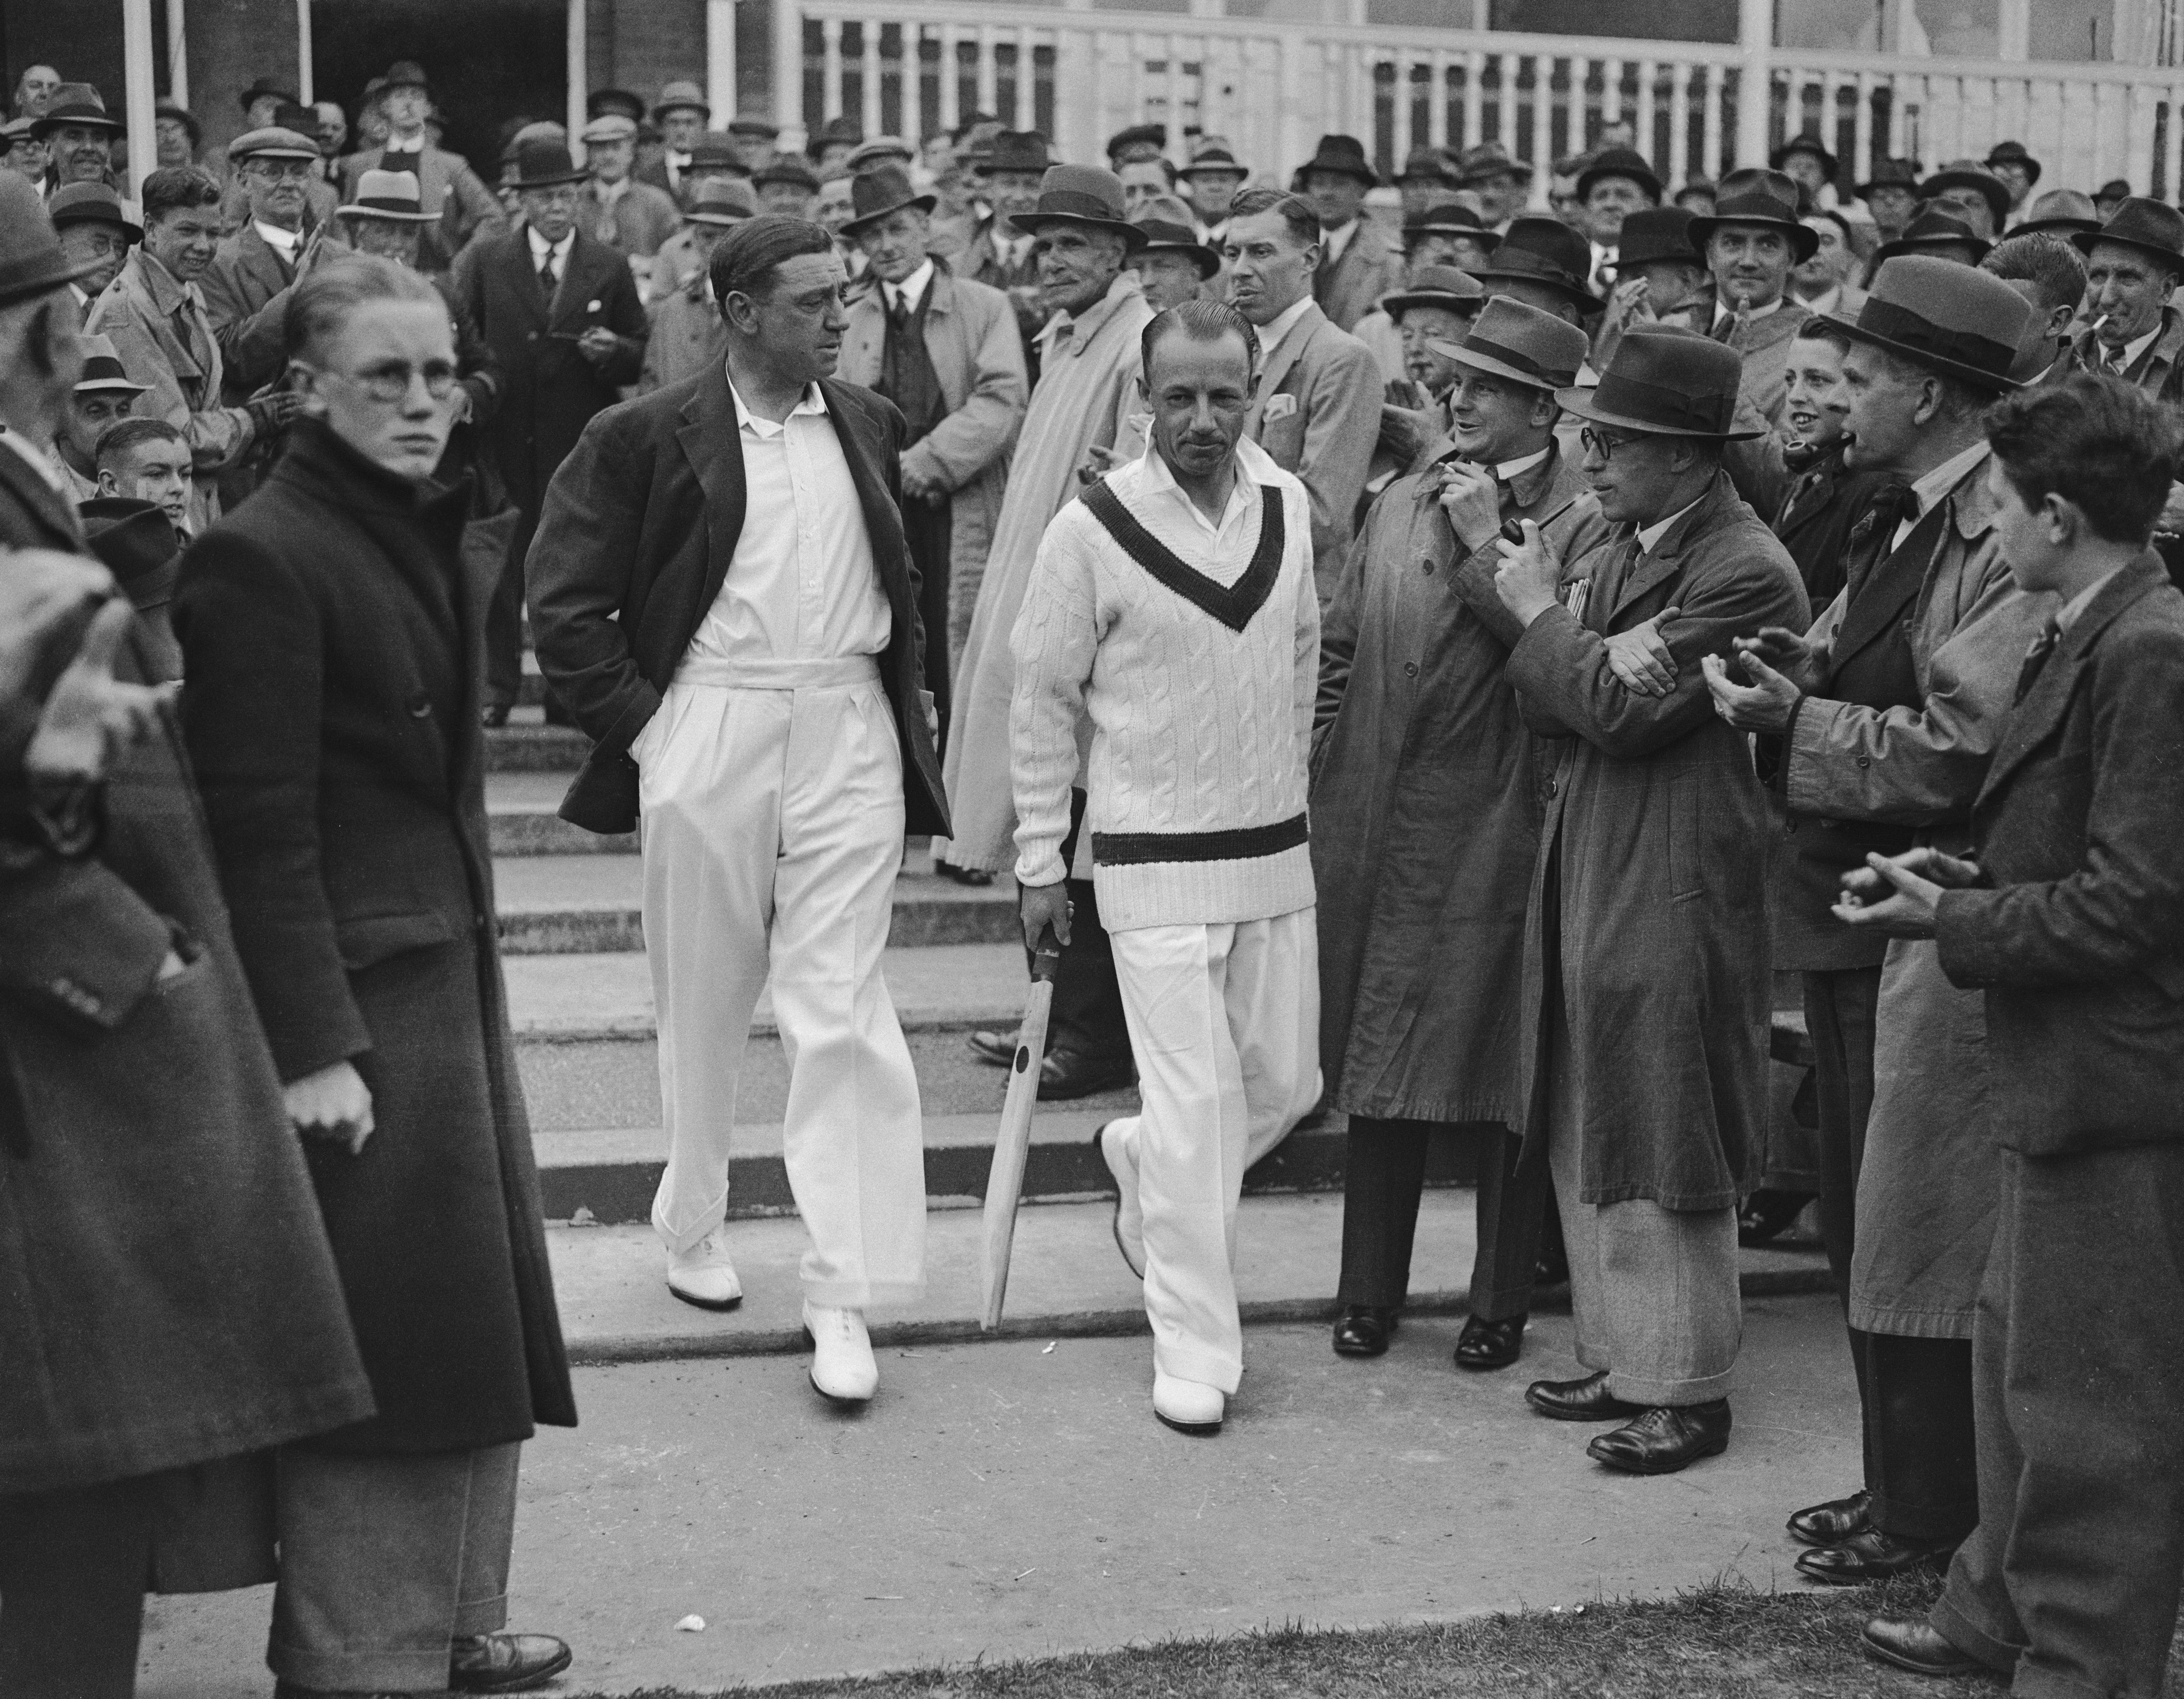
Don Bradman (with Wally Hammond) – always infront
Comparing test batsmen from different eras was always a mugs game. Style of play, playing conditions, bowling attacks have varied so hugely it is almost impossible to make a balanced judgement. But what you can do, using statistics, is rate batsmen according to their contemporaries and get an overall assessment of how good they were/are. You can do this in one simple way – by evaluating the percentage of their team runs they made – its their ‘share price’ if you like.
This mechanism tells you the dominance – as well as consistency – of a certain player. It doesn’t give you their strike rate, but it does tell you how prolific they were and you can set up a ranking order by level – not just amount – of output. It is a way of rating batsmen against each other from different eras. Of course the Don is still top by some way, but there are some other interesting results. See table below.
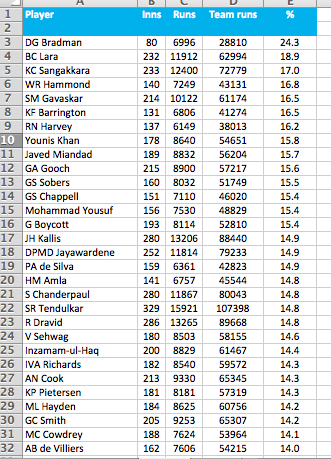
Percentage of a Test team’s runs scored by a player
Bradman’s dominance is extraordinary – he scored almost a quarter of Australia’s runs in his 20 year career. No one else is even above 20 percent. Brian Lara, of course, is easily in second place – he was not only relentless in his scoring but made his runs at a remarkably fast pace too – a strike rate of over 60 (better than anyone else who has made over 10,000 runs.) but kumar Sangakkara’s position at number three (with 17% of Sri Lanka’s runs over his career) is impressive, especially given the other excellent batsmen he played with. Younis Khan – who England will have the job of prising out in the next month is perhaps unexpectedly high at number 8. Graham Gooch is also in the top ten.
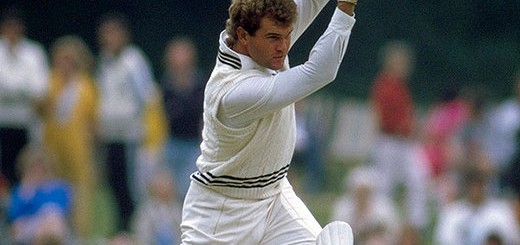
It will give Geoffrey Boycott extra bragging rights (not that he needs them!) that he is at number 14, proving his claim that England needed him more than they would acknowledge, and that is six places higher than Sachin Tendulkar – surprisingly low at number 20 (with 14.8% of India’s runs during his career.)

Don’t apprehend him! Boycs is the 4th most important England batsman who ever lived!
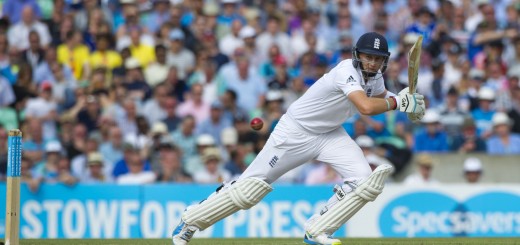
If Alastair Cook needs a boost before this difficult series against Pakistan, he will be pleased that he is marginally ahead of Kevin Pietersen in this table, as well as in his run tally overall.
Perhaps surprisingly none of the other most prolific Australians – Ricky Ponting, Steve Waugh or Allan Border are in the top 30, though they are all just below it. Two things characterize all these men anyway – one they were all outstanding batsmen, and two they were all extremely greedy. But however you analyse it, Bradman always comes out top. If you want to know why, the answers are here….


I’m not sure I can trust an “Analyst” who can’t format a simple table in excel.
Why are you taking up 2 cells for the column headers?
No comma to seperate thousands of runs, % rounded up to only one decimal place. This piece has not been calibrated at all.
well its an odd observation but fair enough. I must go back to the (excel) drawing board…
How different would the list be if you looked at the 1st team innings only? A top 3 batsman gets significantly more innings over a career than does a number 5, due to small chases, declarations and shortened matches. You can’t get any of your team’s runs if you don’t get in to bat.
For example Gooch and Cook bat 1.82 and 1.79 times per match respectively, while Tendulkar and Steve Waugh only got 1.65 and 1.55.
The fact an opening batsman scores the highest percentage of his team’s Test runs is hardly a big surprise – he gets the most chances.
The real stand-outs on this list are therefore Bradman (1.53 inns/match), obviously, the just-surpassed Javed Miandad (a mere 1.52), and the great Viv Richards (only 1.50).
very interesting observations. totally agree with you. very good points. Interestingly Tendulkar scored v few of his 51 100s in winning causes (only 20% I think from memory) and not many in the 3rd and 4th innings.